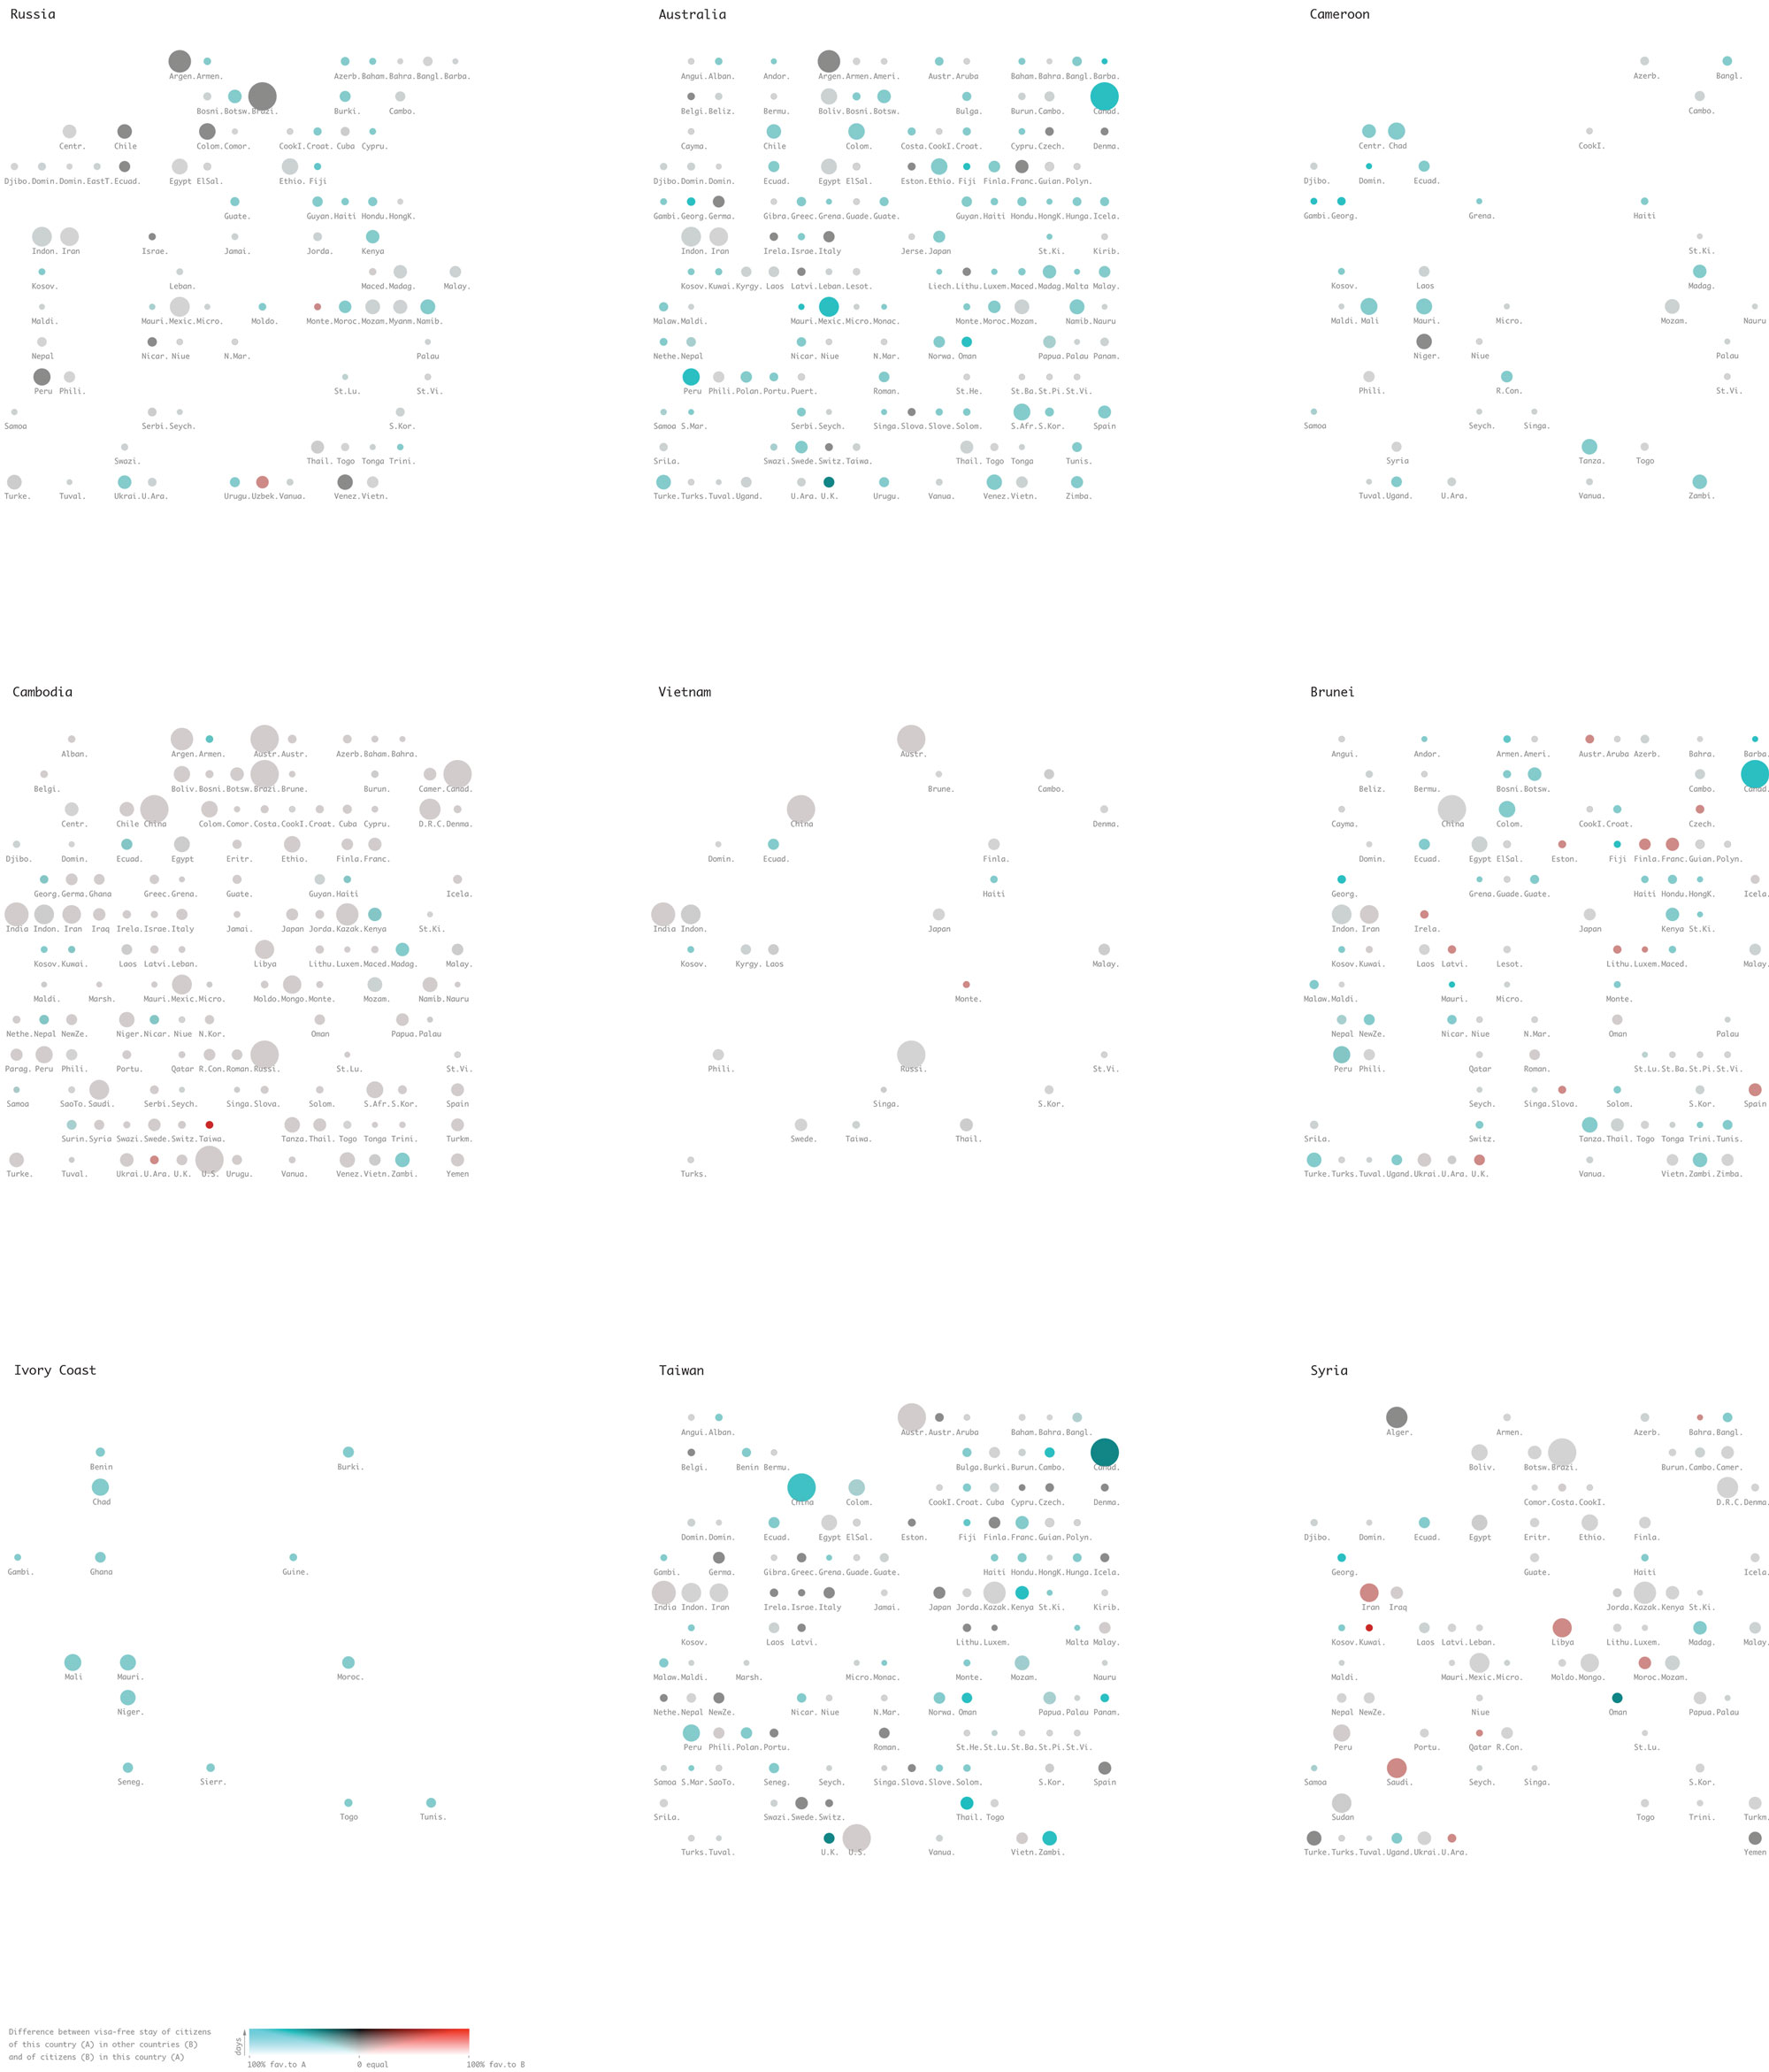
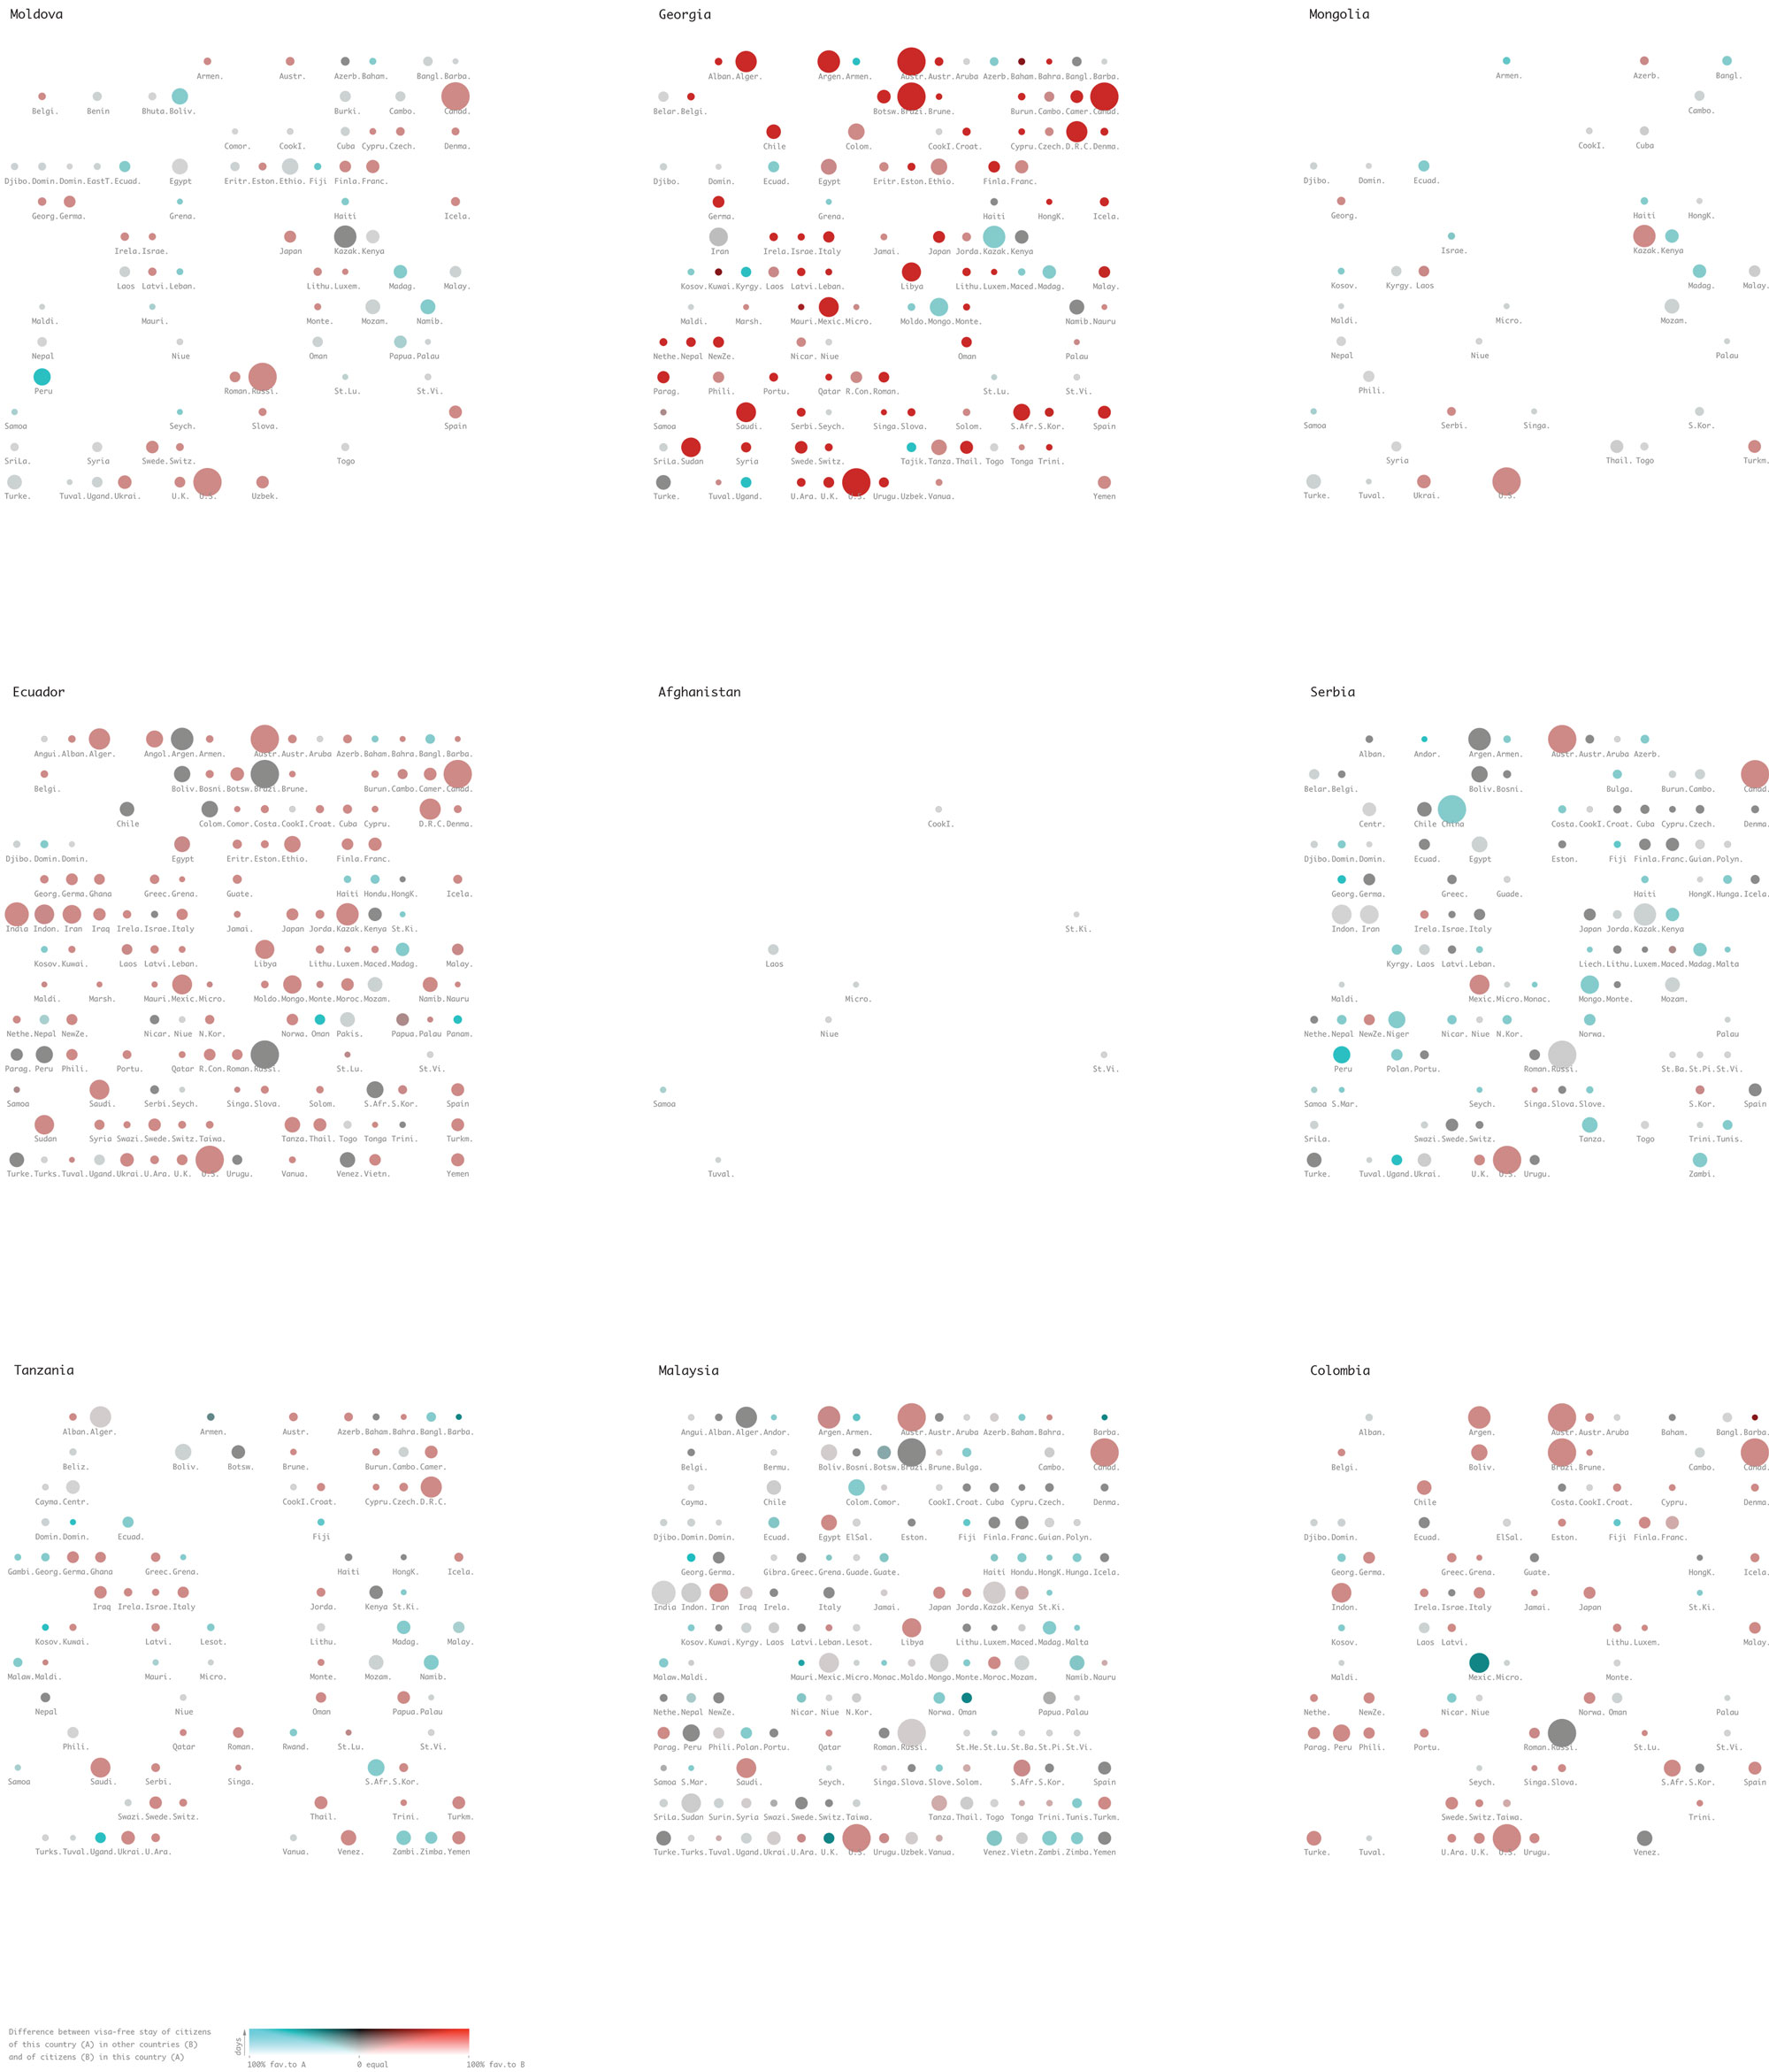
Mobility Policies is a series of visualisations that explore the relationships between time, physical mobility and international affairs. For this project, I gathered data regarding visa requirements for nationals from 142 countries, as well as the respective times they were allowed to stay in countries entered without a visa, by parsing Wikipedia pages with the URL format: http://en.wikipedia.org/wiki/Visa_requirements_for_[citisenship]_citizens.
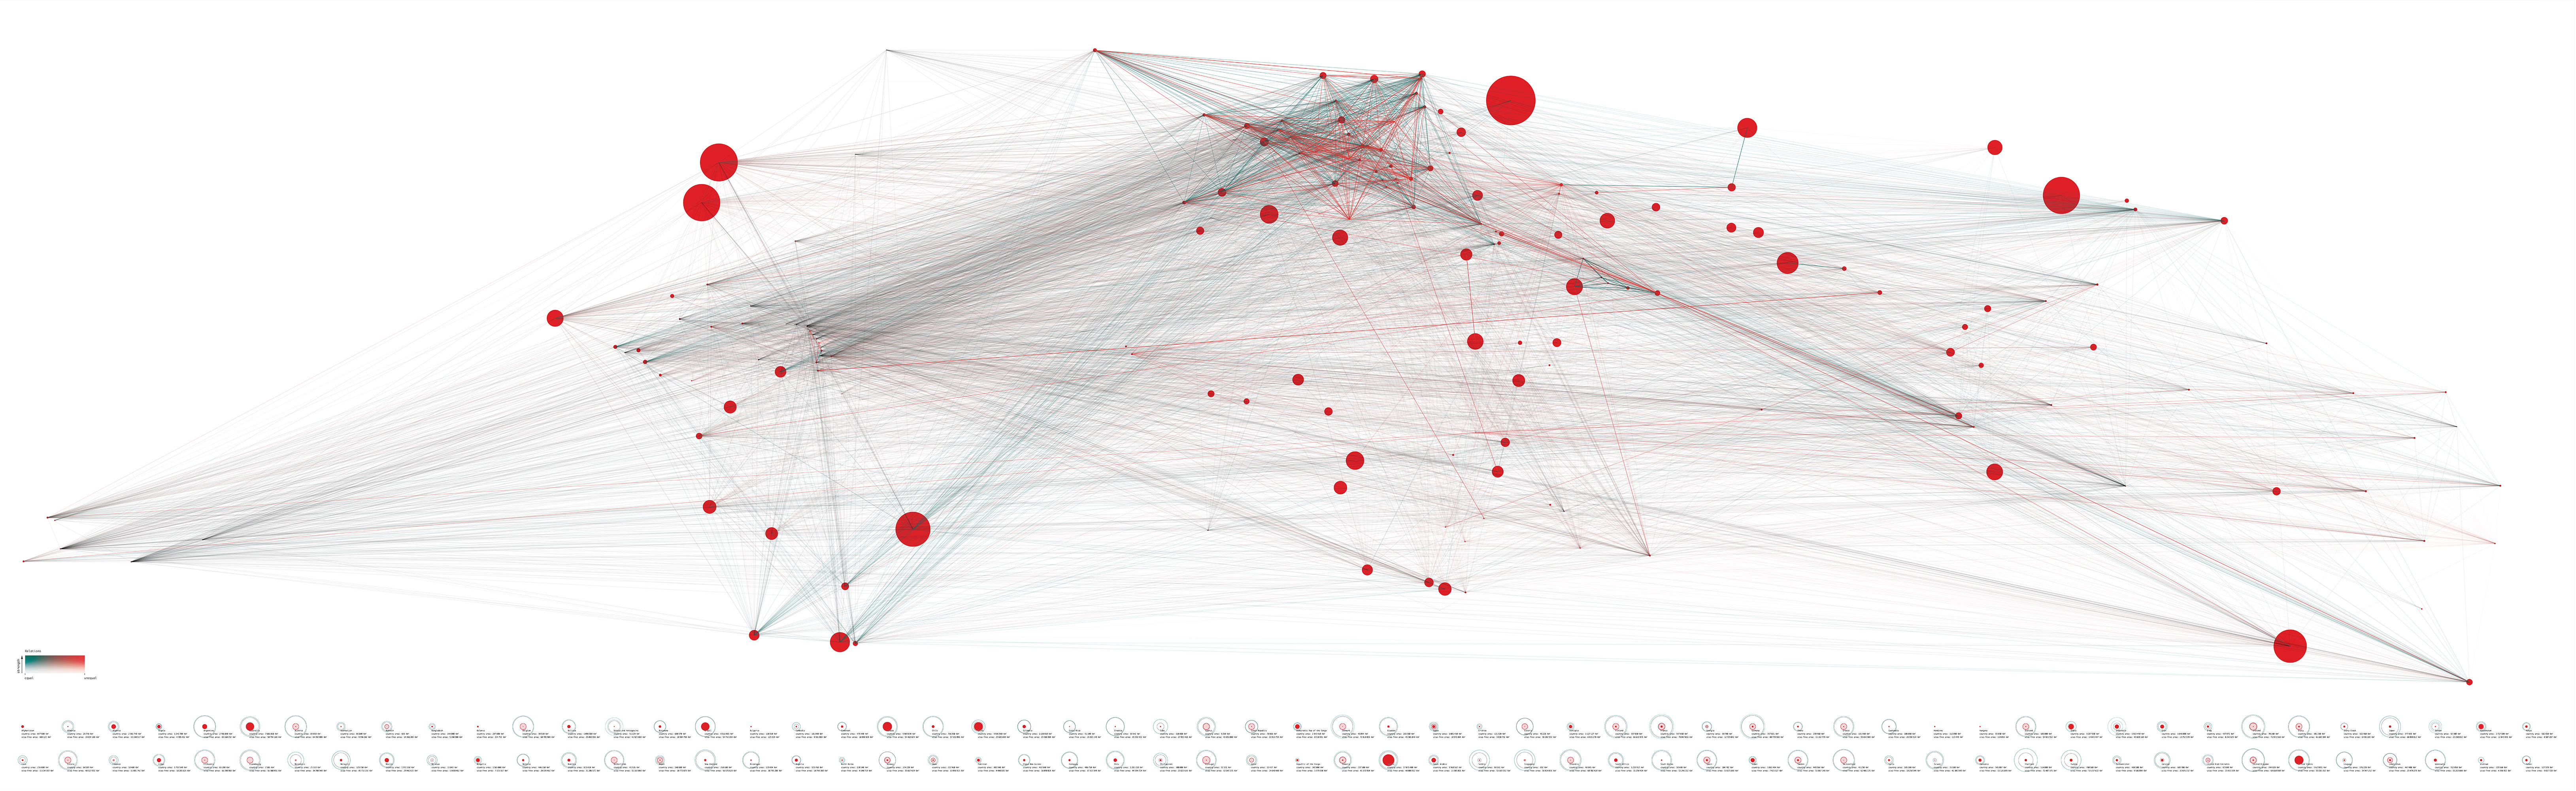
In the larger poster, “How far can you go with a _____ passport?”, the parsed data was plotted on a map in the form of lines connecting each pair of countries. The colours of the lines vary according to the sort of mobility agreement stipulated between the two countries: green was used to represent equal policies and red to represent unequal policies (e.g. citizens of one country can openly visit one country but not the other way around). The strength of the colour represents the strength of the relationship, according to the number of days citizens of each country are allowed to stay. The size of red dots represent the area of each country, limited to a certain maximal and minimum size. Each country dot is placed according to the coordinates of its capital. The relationships between domestic and international areas of mobility are indicated in the row of dots below the map.
The posters were exhibited at kompas and DI Producing Data symposium. They were built with Processing.